
Eurostat: Georgia, Moldova and Ukraine can compare their energy prices with EU countries
Eurostat has recently updated its interactive tool which allows to have a quick overview of energy prices in Europe, including three Eastern Partner countries – Georgia, Moldova and Ukraine. The tool also gives the possibility to compare how energy prices have changed over time and how they differ in countries across Europe.
The Eurostat interactive tool on energy prices is developed to easily visualise energy prices in one’s country. The user can customise the chart by choosing the type of fuel, level of details, consumer, consumption level and measurement unit and compare the country with others using the sorting feature.
The chart can be saved and shared through user’s favourite social media channels. The visualisation tool is available in English, French and German.
Eurostat also provides an overview of energy statistics and articles explaining Electricity price statistics and Natural gas price statistics.
Find out more
MOST READ


SEE ALSO

EU Civil Protection Mechanism delivers powerful transformer to Ukraine

Voice Your Vision: Young European Ambassadors take part in European Forum of Young Leaders in Warsaw

Recently appointed Head of EU Monitoring Mission meets with Georgian Prime Minister
Investments for recovery: EU sets up Investment Framework under its Ukraine Facility
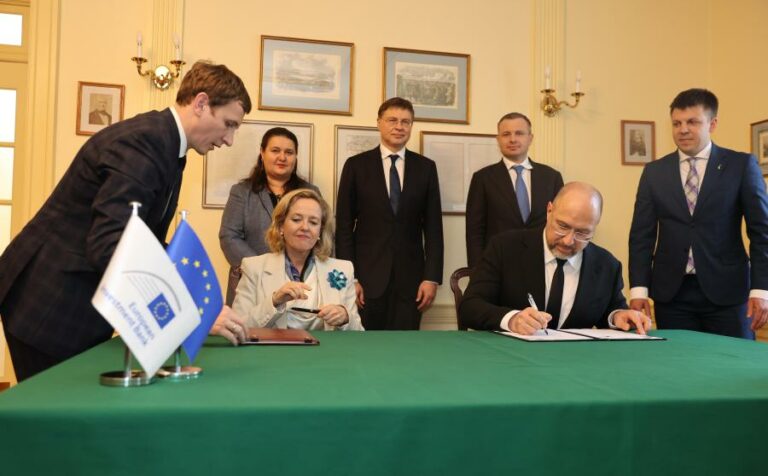
EIB and Ukraine Government to accelerate deployment of financial support and project execution on the ground

The information on this site is subject to a Disclaimer and Protection of personal data. © European Union,